How Did Your Portfolio Do In 2010?

NOTE:  This post is part of an ongoing education series.  This information is for educational purposes only.  This information does not constitute investment advice.  No rational person would make investment decisions based on a blog post.  Please consult with your financial advisor before taking any action.  One of the thing I recommend to all investors is an annual review of your account.  However, you need to have reference points to compare it against.  Below is a short list of some investment averages and how they have done over the last 1,3,5 and 10 years.  These are just for a reference but can be a good guide to see how you are doing.

  1 Year Avg 3 Year Avg 5 Year Avg 10 Year Avg
Europe Stock Average 7.98 -8.44 3.47 6.24
Foreign Stock Average 11.97 -5.88 3.80 5.26
         
Short-Term Bond Average 4.22 3.52 3.92 3.94
Intermediate-Term Bond Average 7.64 5.83 5.45 5.55
Long-Term Bond Average 10.51 7.28 6.11 7.20
         
Large Growth Average 16.00 -2.04 3.01 0.69
Large Value Average 14.11 -3.42 1.62 3.50
Mid-Cap Growth Average 24.58 -0.48 4.70 3.28
Mid-Cap Value Average 21.74 1.07 3.88 7.37
Small Growth Average 26.95 0.60 4.28 4.28
Small Value Average 26.62 4.65 4.65 9.65

If you have a small cap mutual fund then you should have made around 26 -27% return in 2010.  If you only made 10% then either you don't really have a small cap fund or it... er ... um... sucks.  Some funds try hard to stick to one part of the market - others do not so it can be hard to tell.  If you aren't sure how your funds did last year just send me an e-mail and I will look them up for you.  If you have more than $20,000 you should use multiple funds to balance your goal and reduce your volatility.

Below is a sample portfolio.  It is mostly stocks but has some bonds and some international investments as well.  The exact percentages don't matter.  What is important is that the swings are not as big.  Look at the 1 year return of 16.32%.  Not as high as the small cap average but better than bonds, international and large cap.  A variety of funds can lower the volatility - so you can sleep at night.

  1 Year Avg 3 Year Avg 5 Year Avg 10 Year Avg
Sample Portfolio 16.32 1.07 4.55 5.88

I hope this helped and good luck in 2011.

The Lottery As My Retirement Plan

NOTE: This post is part of an ongoing education series. This information is for educational purposes only. This information does not constitute investment advice. Please consult with your financial advisor before taking any action. For planning advice contact Polaris Financial Planning.  Are you worried about saving enough for retirement?  Do you think that buying a lottery ticket is a good way to get to retirement?  Think again!  The lottery should never ever be thought of as a way to save for retirement.

If you want to have a little fun by spending a few dollars on a couple of tickets - go ahead.  But, most people have a hard time understanding the odds of winning.

I see the lottery is a regressive tax that is put in place by lazy politician that don't want to make the needed effort to solve fiscal problems.  A regressive tax places a higher burden on those that can least afford it and in many cases least likely to understand it.

I am going to look at the Mega Millions lottery.

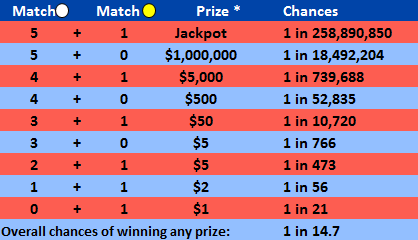
According their website it costs just $1.00 and here are the odds of winning.

Mega Millions index

The odds of winning "any prize" is 1 in 14.7!  So if you play 15 times ($15) you have a good chance of winning $1 and about 1 in 4 chance of winning an extra $2.  I would guess that most people don't play the lottery to win $1 but, it can be enough of a reward to get you to keep "Playing".  So, we will need to look at the odds of winning the big prizes.

The jackpot is tricky to analyze because the amount changes from week to week.  Today the prize is $91 Million if you are willing to wait 30 years for all of the money to be paid out and $56 million if you take it all today.  So if you bought every possible number combination or 258,890,850 tickets you would win $56,000,000.  A payback of about 21.6%.

Your odds of being hit by lightning in your life is about 1 in 12,000.  You are 21,574 times more likely to get hit by lightning then winning the Mega Millions with one ticket.  Well, people who don't know the odds don't just buy one ticket!

What happens if you buy more tickets?  I love to make extreme examples to show how ridiculous things are.  If you spend $100 per day from the age of 18 to the age of 67 in Mega Millions tickets. That would be around 1.788 million tickets (or $1,788,000).  Your odds of winning would be about 0.69%.  There is a 99.31% chance you get nothing (remember we are only talking about the jackpot).

If you invested that money each and every year and made 10% a year you would have over  $40,000,000.  So you could have over $40 million or you could have a less than 1% chance to win $56 million.

Jobless Claims Continue To Fall - Very Slowly

NOTE:  This post is part of an ongoing education series.  This information is for educational purposes only.  This information does not constitute investment advice.  No rational person would make investment decisions based on a blog post.  Please consult with your financial advisor before taking any action.  From CNN

chart_jobless_claims.top.gif

Job news has ben mixed but slightly positive for the past year or so.  It would be even better if the unemplyment rate droped. 

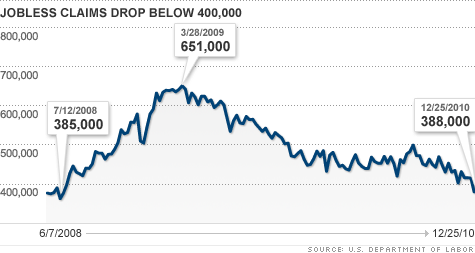
The report marks the first time claims have broken below 400,000 since July 2008 -- two months before the financial crisis peaked with the Lehman Brothers bankruptcy.

"It's impressive to finally see unemployment claims fall below 400,000," said Stuart Hoffman, chief economist with PNC Financial Services, who said that if there were a magic number for unemployment claims, 400,000 would be it.

We are still at risk untill more people get jobs.

How To Pick Winning Stock Every Time - The Skeptics' Way

NOTE:  This post is part of an ongoing education series.  This information is for educational purposes only.  This information does not constitute investment advice.  No rational person would make investment decisions based on a blog post.  Please consult with your financial advisor before taking any action.  Today I will show you how great stock pickers are able to find the winners - every time.  Now when you get a tip via a call or an e-mail from a broker you will know how they do it.  Now you can do it too.  If you use this same method you can guarantee a correct prediction on a stock.  With this system you can win every time.

I found this video from Darren Brown.  He calls it the system and I will stick with that name.  He uses it on horses but, I will tell you how to do it with stocks.  It is even better with stock because they can only go up or down.  It is so easy - it will blow your mind.  The same secrets apply to stocks as it does for horses.  Watch this video to see how it works.  Don't skip ahead... YOU NEED to see how well this works.


In part 2 you see how it works with a coin toss.  A coin has only heads or tails and a stock only has up and down.  Watch and learn.  When we are done you will be able to pick 10 winners in a row.  This system is guaranteed.  You will be able to win over and over again.

Here is part 2.


Part 3 gives another demonstration of the power of the system.  The system uses the power of statistics and probability to make amazing predictions.


By the end of part 3, our gambler has won 4 times in a row.  Proof that the system works.

This is the same thing that happens with the best stock pickers.  They give you a tip and you put a little money down and your stock goes up.  Next time you buy more and make more.  As you gain more confidence in your stock picker - you can invest (bet) more money.  Now you will see that you can do it all on your own.  Here is part 4.

Now you are starting to see how it works.  It is the same way with stocks.

Here is the part 5!

Someone had to win with each bet.  A stock picker can do the same thing.  They will call dozens, hundreds or even thousands of people.  They will tell half of the people that a given stock will go up and the other half will be told that the same stock will go down.  Those that lose never get called again.  The winners are called again and get a new stock tip.  So with just 16 people to start with a stock picker can get 4 in a row for one lucky person.  Now that person will do just about anything.  Even borrow money from friends.  They may or may not make money.  It does not matter to the broker.  Each time you buy or sell a stock, you make will make the broker money.

Now, when someone calls you with a hot stock tip, you will know what to do - RUN!

Global Wealth Distribution

NOTE:  This post is part of an ongoing education series.  This information is for educational purposes only.  This information does not constitute investment advice.  No rational person would make investment decisions based on a blog post.  Please consult with your financial advisor before taking any action.  A fabulous visual representation of wealth and life expectancy for 200 countries of the world set in motion for 200 years.  If only you could know which countries would do well in advance. 

Below is a pie chart of global wealth from Wikipedia.  You can see that the US is over 25% of the total and the top 5 countries account for more than 50%.  The big question is how will this change in the next 5, 10, 20 years!